

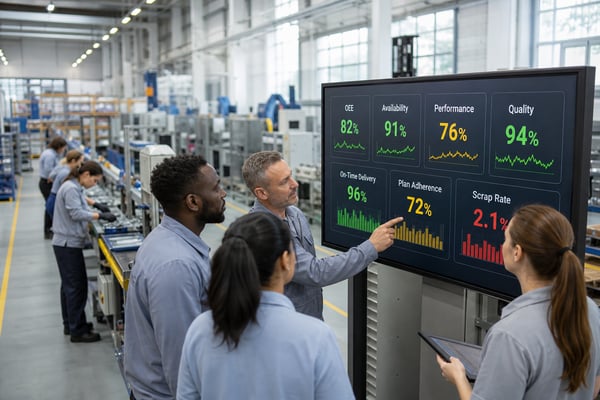
Manufacturing KPIs (Key Performance Indicators) are measurable values that track how effectively a factory achieves its production, quality, delivery, and cost objectives. The right KPIs make problems visible, drive daily decision-making, and create accountability across the shop floor. This guide covers the 12 metrics that matter most, how to calculate each one, what good looks like, and how to build dashboards that people actually use.
Written by David Collins III, CEO of Manufacturing Transformation Group. Based on 14 years of factory improvement work across 400+ manufacturing facilities.
Why Most Factory KPI Programs Fail
There are two types of factory KPI programs: almost non-existent or far too many. They are diametrically opposite but produce the same results: no one is tracking performance in a meaningful way.
Factories with almost no KPIs are typically run by owners that do not understand manufacturing well. Their only KPIs is production or keeping the line moving. Some companies care only that product goes out the door to meet customer demand. The factories do not track how much rework, scrap, or labor is needed. In China, factories like this primarily care about increasing volume believing that high volumes solve all manufacturing challenges.
The type are companies that just produce to keep the line running. MTG worked with a US company that had more than 3 months of production in warehouses. They did not track the SKUs their customers bought and keep producing to be ready for any order type. It was hugely inefficient.
The flip are factories that that track 30 or 40 KPIs. Binders full of charts. Dashboards nobody opens. Monthly reports that arrive three weeks late because somebody has to run around gathering the data.
The result is always the same: nobody acts on any of them.
The problem is not a lack of data. It is a lack of focus. Research shows the human brain retains about three numbers effectively. When you give a production supervisor 15 KPIs, they track zero. When you give them three, they own all three.
The approach that works: 3-4 KPIs per department or production line, reviewed daily. That means a factory with four departments might have 12-16 total KPIs across the organization — but no single team is responsible for more than four.
Here are the 12 that consistently drive the most improvement across the factories we work with.
Production KPIs
1. OEE (Overall Equipment Effectiveness)
What it measures: The percentage of planned production time that is truly productive.
Formula: OEE = Availability × Performance × Quality
- Availability = Run Time ÷ Planned Production Time
- Performance = (Ideal Cycle Time × Total Count) ÷ Run Time
- Quality = Good Count ÷ Total Count
Why it matters: OEE is the single most powerful manufacturing KPI because it reveals hidden capacity. Most factories run at 40-60% OEE, meaning 40-60% of their production capacity is being lost to stoppages, slowdowns, and defects. A factory running at 50% OEE that improves to 65% has effectively added 30% more capacity without buying a single machine.
Targets: World-class is 85%+. Most factories start at 40-60%. Improving from 50% to 65% in 6-12 months is realistic with focused effort.
We wrote a complete guide on how to calculate and improve OEE with step-by-step examples.
2. Capacity Utilization
What it measures: How much of your total available capacity you are actually using.
Formula: Capacity Utilization = Actual Output ÷ Maximum Possible Output × 100
Why it matters: This tells you whether you need more equipment, more shifts, or better use of what you already have. It is the first number private equity firms ask for when evaluating a portfolio company's factory — because low utilization means there is room to grow revenue without capital expenditure.
Targets: 80-85% is healthy. Below 70% means you have significant room to grow. Above 90% means you are running hot and at risk of quality issues or delivery delays.
See our guide on identifying and fixing capacity constraints for practical approaches.
3. WIP Turns (Work-in-Process Turnover)
What it measures: How quickly material moves through your production process.
Formula: WIP Turns = Cost of Goods Sold ÷ Average WIP Inventory Value
Why it matters: High WIP means long lead times, tied-up cash, and quality problems hiding between stations. When WIP goes down, lead times shrink, defects surface faster, and cash flow improves. It is the best single indicator of how lean your production flow actually is.
Targets: Depends heavily on industry. The trend matters more than the absolute number. If your WIP turns are improving month over month, your flow is getting better. It should be multiple times per year. If anything is WIP for more than a year, you have a problem.
Quality KPIs
4. First Pass Yield (FPY)
What it measures: The percentage of units that pass through production correctly the first time, without rework or repair.
Formula: FPY = Good Units (no rework) ÷ Total Units Started × 100
Why it matters: FPY captures the true cost of quality problems. A factory might report 99% final quality — but if 15% of units required rework to get there, the real cost of production is much higher than it appears. FPY exposes that hidden factory of rework.
Targets: 95%+ for most discrete manufacturing. Below 90% indicates serious process control issues that need immediate attention.
Strong FPY depends on solid process controls. See our guide on how to build a process control plan.
5. Scrap Rate
What it measures: The percentage of material or units that cannot be reworked and must be discarded.
Formula: Scrap Rate = Scrap Cost ÷ Total Production Cost × 100
Why it matters: Scrap is pure waste — material, labor, and machine time that produced nothing sellable. Unlike rework, scrapped material cannot be recovered. Tracking scrap rate by line, shift, and defect type reveals where to focus improvement efforts.
Targets: Below 2% for most industries. Above 5% requires urgent root cause analysis. Unfortunately, we have worked with companies all over the world that have over 10% scrap. Literally millions of dollars wasted.
6. Customer Complaint Rate
What it measures: The number of quality complaints per units shipped (usually expressed as PPM — parts per million).
Formula: Complaint Rate (PPM) = (Customer Complaints ÷ Units Shipped) × 1,000,000
Why it matters: Internal quality metrics can look great while customers are still unhappy. Customer complaint rate is the reality check. It also directly impacts your ability to retain and grow accounts — automotive OEMs and medical device companies will drop suppliers who exceed complaint thresholds.
Targets: Below 100 PPM for most B2B manufacturing. Automotive tier 1 suppliers typically target below 25 PPM.
Delivery KPIs
7. On-Time Delivery (OTD)
What it measures: The percentage of orders delivered to the customer on or before the promised date.
Formula: OTD = Orders Delivered On Time ÷ Total Orders × 100
Why it matters: OTD is the metric your customers care about most. Late deliveries erode trust, trigger penalties, and eventually lose accounts. It is also a leading indicator of internal problems — when OTD drops, it usually means production scheduling, material availability, or quality issues are getting worse.
Targets: 95%+ for most industries. Below 90% is a red flag. World-class is 98%+.
8. Manufacturing Lead Time
What it measures: The total time from order release to finished goods, including queue time, processing, and inspection.
Formula: Lead Time = Completion Date − Order Release Date
Why it matters: Shorter lead times mean faster response to customer demand, less inventory, and more flexibility. Most of manufacturing lead time is actually wait time, not processing time. Tracking and reducing lead time forces you to address the root causes: large batch sizes, poor scheduling, bottleneck machines, and excessive WIP.
Targets: Track the trend. A 20-30% reduction in lead time over 6 months is achievable with focused effort on flow and batch size reduction.
9. Schedule Adherence
What it measures: How closely production follows the planned schedule.
Formula: Schedule Adherence = Units Produced On Schedule ÷ Units Planned × 100
Why it matters: You can have high OTD but poor schedule adherence if you are expediting and firefighting constantly. Schedule adherence measures whether your planning process actually works — or whether production is in reactive mode every day. Low adherence drives overtime costs, rushed changeovers, and shipping errors.
Targets: 90%+ is good. Below 80% means your scheduling system needs significant improvement.
Cost KPIs
10. Cost Per Unit
What it measures: The fully loaded cost to produce one unit, including materials, labor, and overhead.
Formula: Cost Per Unit = Total Production Cost ÷ Total Units Produced
Why it matters: This is the bottom-line metric. All other KPIs ultimately drive cost per unit — better OEE means more units over the same fixed costs, higher FPY means less rework labor, better OTD means fewer expediting charges. Track it monthly by product family to spot trends before margins erode.
Targets: Varies by product. Focus on the trend — a steady decline means your improvement efforts are working.
11. Labor Productivity
What it measures: Output per labor hour, or revenue per employee.
Formula: Labor Productivity = Total Output ÷ Total Direct Labor Hours
Why it matters: In most factories, labor is 15-30% of production cost. Tracking productivity by line and shift reveals which teams are most effective and where training, tooling, or process improvements are needed. It also highlights whether you are overstaffed or understaffed relative to your current volume.
Targets: Compare across shifts and lines rather than against industry benchmarks. A 10-15% gap between your best and worst shift is an improvement opportunity.
Standardized work instructions are key to consistent productivity across shifts. See our guide on how to write effective standard work instructions.
12. Unplanned Downtime
What it measures: The percentage of scheduled production time lost to unexpected equipment failures, material shortages, or other disruptions.
Formula: Unplanned Downtime % = Unplanned Downtime Hours ÷ Scheduled Production Hours × 100
Why it matters: Unplanned downtime is the single biggest destroyer of OEE and on-time delivery. Every hour of unplanned downtime cascades through the schedule — pushing back other orders, triggering overtime, and forcing expedited shipping. Tracking it by cause category (equipment failure, material shortage, quality hold, changeover overrun) reveals where preventive action will have the most impact.
Targets: Below 5% for most factories. Above 10% is a crisis. World-class operations run below 2%.
How to Build a KPI Dashboard That People Actually Use
A KPI is only useful if it changes behavior. Here is what separates dashboards that drive improvement from dashboards that collect dust:
Keep it visible. The dashboard belongs on the factory floor, not in a management office. Large-format screens or whiteboards at each production line, updated every shift. If people have to log into a system to see their KPIs, most of them never will.
Use red/yellow/green. Every metric should have a clear target. Green means on track, yellow means watch closely, red means act now. No interpretation required. See our guide on visual management boards for detailed implementation advice.
Update daily, not monthly. Monthly KPI reviews are autopsies — they tell you what went wrong after it is too late to fix. Daily reviews catch problems early enough to course-correct. The most effective factories update production KPIs every shift.
Drive a daily standup. The dashboard should be the centerpiece of a 10-15 minute daily meeting. The team reviews each KPI, identifies anything in the red, and assigns an owner and a deadline for corrective action. No standup, no accountability, no improvement.
Three KPIs per team, maximum four. The human brain retains about three numbers. Give a supervisor 15 metrics and they own zero. Give them three and they own all three. More KPIs can exist at the plant level, but each team should only be responsible for the few that they directly influence.
Supplier KPIs: What to Track When You Do Not Own the Factory
If you are sourcing from external suppliers — whether domestically or internationally — you need a parallel set of KPIs. The four that matter most:
- Delivery Performance: Percentage of orders received on time and in full (OTIF). Track weekly, review monthly.
- Quality Performance: Incoming defect rate or lot rejection rate at your receiving inspection. Any trend upward is an early warning.
- Lead Time Reliability: Actual lead time vs. quoted lead time. Inconsistency here disrupts your planning and drives safety stock costs.
- Responsiveness: How quickly does the supplier acknowledge issues, provide corrective actions, and communicate delays? This is harder to quantify but reveals whether you are dealing with a partner or just a vendor.
Track these monthly and conduct formal quarterly reviews with each critical supplier. Bring the data. Suppliers who consistently underperform on these metrics need a corrective action plan with clear deadlines — or replacement.
Getting Started: A Practical Approach
If your factory is not tracking KPIs today — or tracking too many — here is how to start:
- Pick one KPI per category. Choose the most painful gap in production, quality, delivery, and cost. That gives you four KPIs to start.
- Establish a baseline. Measure each one for two weeks without trying to improve it. You need to know where you are before you can set a target.
- Set a 90-day target. Make it ambitious but achievable — a 10-15% improvement is realistic for most metrics.
- Make it visible. Put the dashboard on the floor. Start the daily standup.
- Add KPIs gradually. Once the first four are embedded and driving improvement, add one more per category as needed.
The factories that improve fastest are not the ones with the most sophisticated dashboards. They are the ones where every operator on the floor can tell you their three numbers and what they are doing today to make them better.
Need help setting up KPIs that drive results?
Manufacturing Transformation Group helps factory teams implement KPI systems that stick — from selecting the right metrics to building floor-level dashboards to training supervisors on daily management. Get in touch to discuss your factory's specific situation.